
BUSINESS
Brent at $100 Puts the Fed Rate Call on Stale Data
Brent crude topped $100 after U.S. tanker strikes, two days before PPI and three before CPI, leaving the September Fed vote on August prices.

Brent crude topped $100 a barrel on Wednesday, the first time since July, after U.S. strikes on five Iranian tankers. Dow futures were down 331 points, or 0.6%, with S&P 500 futures off 0.4% and Nasdaq-100 futures off 0.5%.
Producer prices print Thursday and consumer prices Friday, both for August. The Federal Reserve votes the following Wednesday. That sequence, not the barrel print itself, is what equity traders are now pricing.
Five Tankers and a $100 Print
U.S. Central Command said its forces destroyed five Iranian crude oil carriers on September 8, after the Islamic Revolutionary Guard Corps fired ballistic missiles at a U.S. Navy warship twice in two days. The warship evaded both attempts. No American personnel were harmed, the Tampa command said, and crews were told to leave before the ships were hit.
THE SHIPS CENTCOM NAMED
- M/T Kaviz: Struck in the Gulf of Oman with three other carriers.
- M/T Charminar: Listed with Kaviz, Horizon 1 and Riesco in the same Gulf of Oman group.
- M/T Horizon 1: Fourth Gulf of Oman target in the September 8 action.
- M/T Riesco: CENTCOM later released video it said showed this hull going down.
- M/T Derya: Hit near Kharg Island, Iran’s main crude export hub.
The same statement said CENTCOM had already destroyed three Iranian crude carriers on September 5, after the IRGC tried to attack an aircraft carrier and a guided-missile destroyer. All of those attempts against U.S. Navy ships have failed, the command said. The tankers, it added, were part of a multibillion-dollar shadow fleet used to fund the IRGC and its proxies.
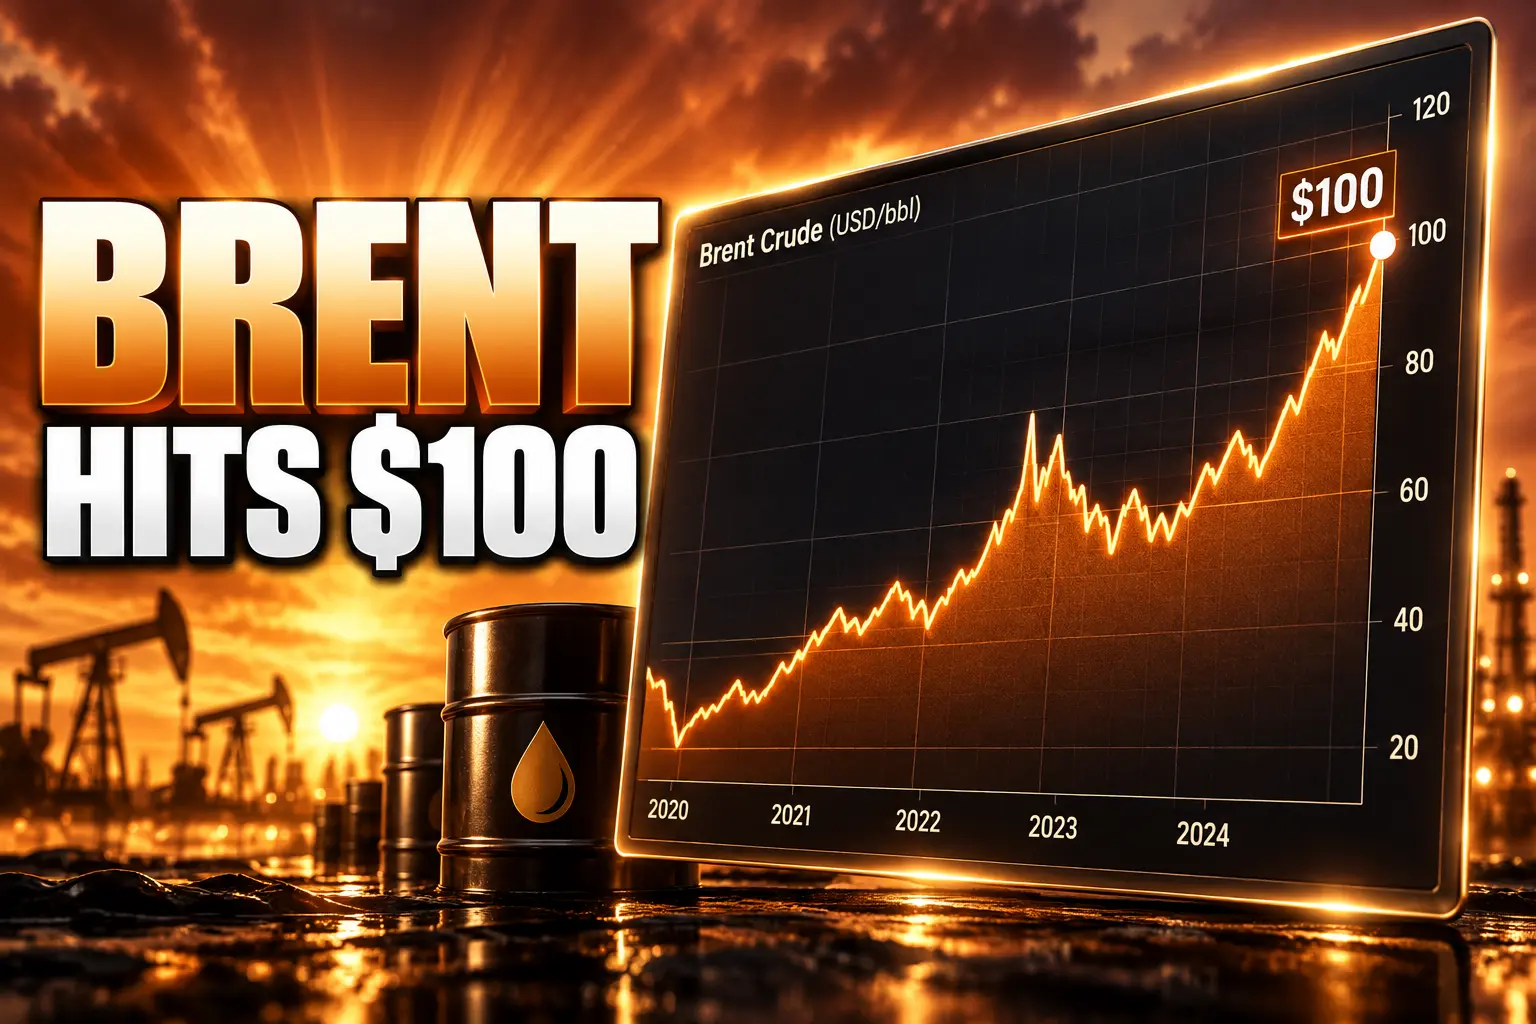
Brent, the international benchmark, last traded through $100 on July 23 and 24, when it printed $105.32 and then $100.31. Tuesday’s Brent settlement was $97.92. By Wednesday morning it was at $100.67, up 2.81%. West Texas Intermediate, the U.S. grade, was at $95.15, up 2.28%. Before the war began on February 28, Brent was near $72 and WTI near $67.
The 10-Year Yield Is Doing the Damage
U.S. stocks were closed Monday for Labor Day. They opened Tuesday into rising crude and closed lower across the board. The Dow Jones Industrial Average fell 628.18 points, or 1.18%, to 52,786.07, its worst session in almost three weeks. The S&P 500 lost 0.58% to 7,673.52. The Nasdaq Composite slipped 0.32% to 26,421.41.
TUESDAY’S CLOSE AND WEDNESDAY’S OIL
| Gauge | Level | Move |
|---|---|---|
| Dow Jones | 52,786.07 | -1.18% Tuesday |
| S&P 500 | 7,673.52 | -0.58% Tuesday |
| Nasdaq Composite | 26,421.41 | -0.32% Tuesday |
| Brent crude | $100.67 | +2.81% Wednesday |
| WTI crude | $95.15 | +2.28% Wednesday |
| 10-year Treasury | 4.81% | Near a three-year high |
The 10-year U.S. Treasury yield, which had already poked above 4.8% on Tuesday, was near 4.81% on Wednesday. That is the channel that hits index futures. A higher long rate compresses the value of future earnings just as energy costs are climbing for airlines, shippers, and anyone else that burns distillate.
Kara Murphy, investment chief at Kestra Investment Management, called the tape a pause after earnings season thinned out.
It’s a little bit of a speed bump. There’s a little bit less to focus on with the earnings front, so I think the market has sort of shifted its attention now to the risk side.
Kara Murphy, investment chief, Kestra Investment Management, on Closing Bell
The bond market is not treating $100 oil as a one-session event. Charlie Bilello, chief market strategist at Creative Planning, tallied price changes since the Iran war began and put WTI crude up 41% and gasoline up 39%, with diesel up 57%, jet fuel up 62%, and heating oil up 78%. Daniel Lacalle, chief economist at Tressis, pushed back on the crisis reading, noting that in today’s dollars the 2022 spike was about $139 and the 2008 peak about $202. Both things can be true at once: $100 is not 2008, and it is still high enough to move the 10-year into a Federal Reserve meeting.
Waller Tied His Vote to August Inflation
Christopher Waller, a Federal Reserve governor, set his own test on September 3, before this week’s tanker strikes. Inflation, he said, remains above the committee’s 2% goal and has been there for five and a half years. July PCE prices rose 0.2%, and core prices excluding food and energy also rose 0.2%. Over 12 months, PCE is up 3.7% and core PCE 3.3%. Measured over three months through July, core inflation is 3.05%, down from 4.76% in February.
He was willing to hold the funds rate, now in a 3.50% to 3.75% band, if that cooling showed up again in August. He was also willing to tighten if it did not.
If the incoming data for August show this improvement has been fleeting, then it may be appropriate to raise the policy rate when the FOMC meets on September 15 and 16.
Christopher J. Waller, Federal Reserve governor, September 3, 2026
Waller said energy prices have moved up again and remain higher than they were at the start of 2026, but that, at least so far, they had not bled widely into other goods and services. He also said policy is only slightly restricting demand, and that it may not take much of an acceleration in inflation to push him toward a hike. He will raise the policy rate on September 15 and 16 if August looks hot; he will hold if it does not. That reaction function was written against July’s oil, not against a $100 Brent handle two days before the producer-price report.
The real side, in his telling, is not the constraint. Real GDP grew at a 1.8% annual rate in the first half. Real private domestic final purchases rose 3%. Job gains averaged about 60,000 a month through July, and the unemployment rate was 4.1%. August payrolls later printed at 162,000, with unemployment still 4.1%. Waller said those figures will not drive his vote. August inflation will.
How Much Oil Still Clears Hormuz
The tanker hits matter because the strait they sit beside is already running far below its peacetime load. The U.S. Energy Information Administration’s August Short-Term Energy Outlook, using Vortexa tracking plus its own adjustments for dark transits, put total oil flows through the Strait of Hormuz at 21.6 million barrels a day in the fourth quarter of 2025. That was about one-fifth of world oil supply then.
By the first quarter of 2026, after fighting began on February 28, the EIA had the strait at 14.9 million barrels a day. In the second quarter it was 4.9 million barrels a day in the second quarter, or 22.7% of the late-2025 pace. Liquefied natural gas through the same waterway fell from 10.5 billion cubic feet a day to 0.8.
HORMUZ FLOWS IN THE EIA TABLES
| Period | Total oil (mbd) | Crude and condensate | Products | LNG (bcf/d) |
|---|---|---|---|---|
| 4Q 2025 | 21.6 | 15.9 | 5.7 | 10.5 |
| 1Q 2026 | 14.9 | 10.9 | 4.0 | 7.4 |
| 2Q 2026 | 4.9 | 3.7 | 1.1 | 0.8 |
World oil supply in the EIA’s second-quarter column was 99.7 million barrels a day, down from 108.2 million in the third quarter of 2025. AIS signals in the strait have been unreliable since late February, the agency warned, and the Hormuz figures are revised often. Bypass routes have taken some of the load: Saudi volumes out of Yanbu on the Red Sea, the UAE’s Habshan-Fujairah pipeline, and Iraq’s line through Turkey. Those workarounds did not stop Brent from revisiting $100 once the United States started lighting up IRGC hulls again.
Kharg Island, where the Derya was hit, handled about 90% of Iran’s oil exports before the war. Destroying a shadow-fleet tanker near that terminal does not close Hormuz on its own. It does tell a market that already cut the strait’s throughput by more than three-quarters that the remaining barrels are still in the line of fire.
Labor Day Gas Already Set a Holiday Record
Drivers met that barrel at the pump over the holiday weekend. AAA put the Labor Day national average of $4.15 a gallon for regular unleaded, the first Labor Day above $4 and above the old holiday mark of $3.82 set on September 3, 2012. Diesel averaged $5.90 a gallon. A year earlier, regular was about $3.20, so the holiday print was about 30% higher. AAA’s reading on September 8 was $4.1514. The 2026 peak remains $4.56 a gallon, reached in May, and the all-time high is still $5.02 from June 2022.
THE HOLIDAY PUMP
- Labor Day regular: $4.15 a gallon, first holiday reading above $4.
- Prior holiday mark: $3.82 a gallon on September 3, 2012.
- Year-ago regular: About $3.20 a gallon, a 30% rise.
- Labor Day diesel: $5.90 a gallon, with the 2026 gasoline peak still $4.56 from May.
Brittany Moye, a spokesperson for AAA, said the usual post-summer drop in gasoline demand has been offset by high crude costs. The EPA issued an emergency waiver in August that allowed winter-blend gasoline from September 1, two weeks earlier than the normal September 15 switch, to try to add supply. That waiver does not change the energy line that will show up in Friday’s CPI. Headline CPI is expected to rise 0.4% in August after 0.1% in July, with core at 0.2%. Thursday’s PPI is expected to rise 0.4% as well, taking the yearly rate to 5.3% from 4.7%.
Those forecasts were written before Brent settled at $97.92 and before it crossed $100. August gasoline prices will be in Friday’s report. Wednesday’s $100 handle will not.
Europe’s Retailers Pay What Energy Collects
European stocks opened lower as the same barrel hit a region that imports most of its crude. Energy shares led early gains, up 0.85%, while retail fell 1.52%, travel and leisure 1.18%, and banks 0.96%. The Stoxx 600 was down 0.69% in the source tape. By midday in London the FTSE 100 was down 1.04% at 10,699.01 and Germany’s DAX was down 1.50% at 25,617.85.
Asia had already closed mixed. Japan’s Nikkei 225 finished at 65,142.78, down 0.19%. South Korea’s Kospi rose 1.40% to 7,051.64. Mainland China’s CSI 300 gained 0.30% to 4,572.60 after the National Bureau of Statistics said August producer prices rose 3.8%, above a 3.6% forecast and July’s 3.5%. Consumer inflation there was 0.8%, in line with estimates. Higher commodity costs and tech demand, not household spending, did most of that wholesale lift, economists said, as Beijing’s trade-in subsidies faded.
That split is the equity market’s first-order read of $100 oil: producers and a few Asian exporters catch a bid, while retailers, airlines, and rate-sensitive banks give it back. U.S. index futures followed the second group, because the S&P 500’s largest weights are not crude producers, and because the 10-year at 4.81% does more damage to a 7,673 S&P than a single energy uptick can repair.
September 16 Will Rest on Last Month’s Prices
The Federal Reserve’s calendar is now the only one that matters for this tape. PPI for August is due at 8:30 a.m. Eastern on Thursday, September 10. CPI for August follows at the same hour on Friday, September 11. The FOMC then holds a two-day meeting on September 15 and 16, with the rate decision and a new set of projections at 2 p.m. on the 16th. Chairman Kevin Warsh will have to pick a side if the room splits. Waller has already said a small adjustment would be enough if August reversed the cooling he thought he saw.
THE PRINTS BEFORE THE VOTE
- September 8, 2026: CENTCOM destroys five IRGC-linked crude carriers after missile attacks on a U.S. warship.
- September 10, 2026: August producer prices are released at 8:30 a.m. Eastern, with the yearly rate seen rising to 5.3%.
- September 11, 2026: August consumer prices are released at 8:30 a.m. Eastern, the last inflation print before the FOMC sits.
- September 16, 2026: The committee announces its decision at 2 p.m. Eastern, with a Summary of Economic Projections.
There are no major U.S. economic releases or earnings on Wednesday to compete with the oil tape. That empty calendar is why a tanker strike in the Gulf of Oman can reprice the S&P 500 by Wednesday’s open. It is also why the vote next week will feel oddly dated. Waller was explicit that he does not want to throw out categories, and that nonmarket services, energy, and tariffs have all distorted the 12-month figures. He still put his September ballot on the August inflation reports. Those reports close before Brent’s Wednesday trade is even a footnote in a monthly average.
The committee votes at 2 p.m. on September 16. August CPI, released September 11, will be the last inflation number in the room. The $100 barrel will not be.
Disclaimer: This article is news reporting and analysis of market prices, energy flows, and scheduled Federal Reserve decisions, and it is for information only. It is not investment advice, a recommendation to buy or sell any security, commodity, or Treasury, or a forecast of what the FOMC will do. Readers who are considering portfolio or hedging decisions should consult a licensed financial adviser who can review their own holdings and time horizon. Index levels, oil prices, yields, and inflation forecasts reflect the sources cited as of September 9, 2026, and will change as new prints and trades arrive.

U2 Puts Carnaval de Luz After a Year of Ashes

Hans Zimmer Takes the Next Level Across 30 Arenas

Goldman’s $1.2 Trillion AI Capex Needs $300 Billion in Revenue

When Chatbots Finish the Homework, Real Work Gets Scarce

Harvard Study Cuts Wasted Cache Promotions 20 to 60 Percent

Bravo Cuts Nathan Gallagher but Still Airs Below Deck

Google AI Mode Adds Paginated Follow-Ups With Skip

Apple Uses a Returned MacBook to Press OpenAI Hardware

Dawnwalker Hits 1 Million as Players Stretch Its Clock

Australia’s Teen Social Media Ban Still Lets Most Kids In
-
 ENTERTAINMENT3 weeks ago
Bravo Cuts Nathan Gallagher but Still Airs Below Deck
-
 NEWS3 weeks ago
Google AI Mode Adds Paginated Follow-Ups With Skip
-
 NEWS4 weeks ago
Apple Uses a Returned MacBook to Press OpenAI Hardware
-
 GAMING3 weeks ago
Dawnwalker Hits 1 Million as Players Stretch Its Clock
-
 NEWS3 weeks ago
Australia’s Teen Social Media Ban Still Lets Most Kids In
-

 NEWS3 weeks ago
Compliance AI Adds Work for More Teams Than It Saves
-
 NEWS3 weeks ago
Harvard Study Cuts Wasted Cache Promotions 20 to 60 Percent
-
 NEWS3 weeks ago
When Chatbots Finish the Homework, Real Work Gets Scarce